When I was a kid, damn did I ever want a two-headed coin!
They looked so cool in movies and television shows.
Plus, I figured I could win a lot of bets with one!
Props to anybody with a crazy memory like mine who can remember a store at Bathurst & Eglinton called “Bowzer’s Den Of Magic.” I think it was Bowzers. It could have been “Browzers,” I suppose, but that sounds odd. It was next to a sports-card store called “The Sports Connection” and man oh man, were those guys ever over-priced!
I went to Bowzer’s with my friend Jeff, in search of a two-headed coin.
I guess you could say that we went through our magic phase, which was one of many, many phases we went through as kids. For whatever reason, trick handcuffs, phosphorus gel to create smoke, flash paper, loaded card decks, and other tricks and gimmicks were all the rage.
But a two-headed coin?
That would take things to the next level!
We did find a two-headed coin at the “den of magic,” but it was an American nickel.
I figured that any magic trick or attempt to win a coin-flip bet with an unsuspecting friend of family member, while using an American coin, might raise questions.
I asked the gentleman at the store (who’s name was presumably Bowzer…) if he had a Canadian two-headed coin, and he took a long pause as though he was thinking, then said, “Hang on.”
He went into the back and came out with a coin – but not one in the package, like the two-headed American nickel, but rather a Canadian quarter in the palm of his hand.
He showed it to us, then flipped it over.
Two heads.
“Thirty dollars,” he told me, to my absolute dismay.
The two-headed American nickel was only five dollars! And he wanted six times that amount for the two-headed Canadian quarter?
It was absurd.
So I paid five dollars and bought the two-headed American nickel.
I went home with the coin and attempted to bet my father on a scam of some sort, and I suggested that we flip a coin.
He looked at the coin, looked at me, and then said, “How come you’ve got an American coin?”
I should have bought the damn quarter…
We talked a lot last week about interest rates, the Bank of Canada, the economy, and of course how we’re doing compared to our American counterparts.
There’s a big mix of opinion right now on the Toronto real estate market, just as there is with looming interest rate cuts.
I think back to January when the average home price was $1,026,703, meaning it was lower than in January of 2023, and a commenter on TRB suggested that the market was “going nowhere but down.”
I went on the offensive, suggesting that his prediction was nonsense. The average home price had increased from January to February every single year since 2002.
The average home price is up 12.6% since then.
I was amazed then, as I am now, that there are still people that bearish on the real estate market.
But April’s TRREB stats provide two very different sides, depending on how you want to use the data.
I spent a good portion of Friday and the weekend looking over the numbers, and while I remain bullish on the market, I do understand how some people could view these statistics and become bearish.
So with that said, let me try to present the data while maintaining that there are two sides to every coin.
First, let’s look at the average home price:
The average home price is up 3.1% in April, over March.
As mentioned, it’s now up 12.6% since the “trough” in January.
More importantly, the average home price is up over September, October, and November of last fall.
Year-over-year, the average home price is up modestly. But up, nonetheless.
I have maintained since the start of 2024 that my biggest question remains: will the average home price top the peak of $1,196,101 set last year?
That remains to be seen, but we’re one month away from knowing.
As for that 3.1% increase, you could argue that this is a bullish sign, or you could argue that it was entirely predictable based on the track record from March to April:
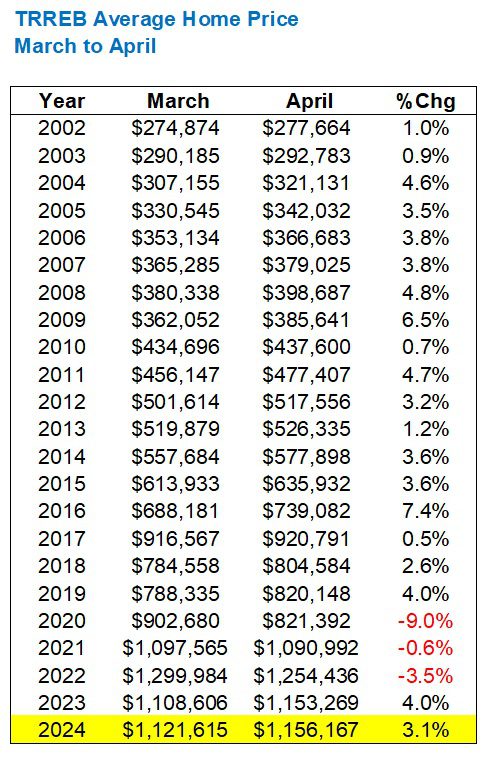
Let’s remember that the 9.0% drop in average home price in 2020 was due to the pandemic.
However, it’s quite telling that we saw a decline in 2021 and 2022 as well.
After a 4.0% increase in the same time period last year, the 3.1% increase is a bullish indicator for sure.
Was it “enough” of an increase? I think so. We’re really splitting hairs here if we were to suggest that “anything shy of the 4.0% increase in the same period last year is indicative of a poor performance.”
For the record, a 4.0% increase over March would have put the average home price at $1,166,480, so we’re talking about $10,000 here.
Now, where was most of the increase found?
In the 416, it would seem:
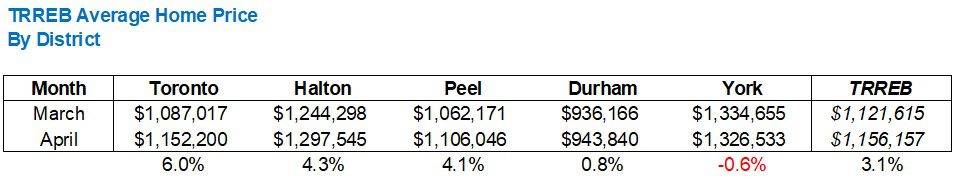
While the GTA average increased by 3.1%, month-over-month, it was almost double in the 416.
Halton and Peel were above-average movers as well, although it was surprising to see a decline in York Region.
Let’s analyze that 6.0% increase in the 416 a bit more by looking specifically at property types:
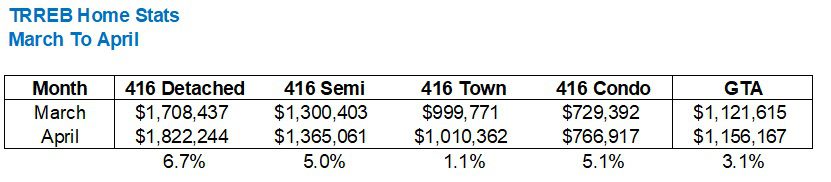
The 416-detached figure of $1,822,244 is well ahead of April, 2023, as well as last fall. But there’s a long way to go to catch last May’s figure of $1,913,132.
In my opinion, the price stats are all good, no matter where you look.
And for some market onlookers, that’s all that matters.
Cash is king, right?
But if you look at sales and listings statistics, it’s very, very strange.
We saw 7,114 sales in the month of April.
That’s it.
An 8.4% increase over March, but a decline from April of 2023.
What’s more, is that this is actually the fewest sales in any month of April this millennium, save for the pandemic-affected month of April, 2020:
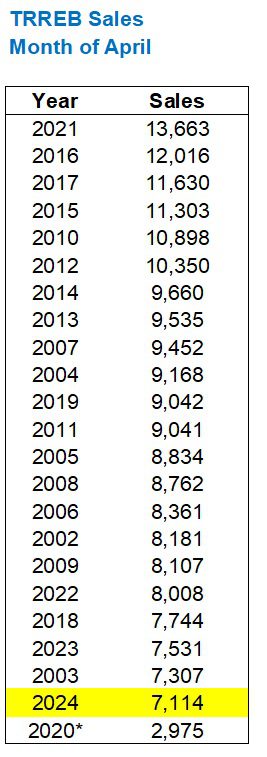
That’s quite surprising!
Those 7,531 sales in April of 2023 were the result of low inventory.
Right?
That’s what we were all saying!
“There’s nothing out there! There’s no inventory!”
And considering there were only 11,364 new listings in April of 2023, the argument held. That was fewest new listings in any month of April, outside of the pandemic.
But last month, we saw 5,577 more listings than in April of 2023:

So to see fewer sales with 5,577 more listings suddenly doesn’t allow for the argument, “There’s nothing out there.”
And that’s where the relationship between sales and new listings was really underscored for me.
Because in April 0f 2023, we saw a very high sales-to-new-listings ratio. 66.3%, to be exact.
And in April of 2024?
Well…
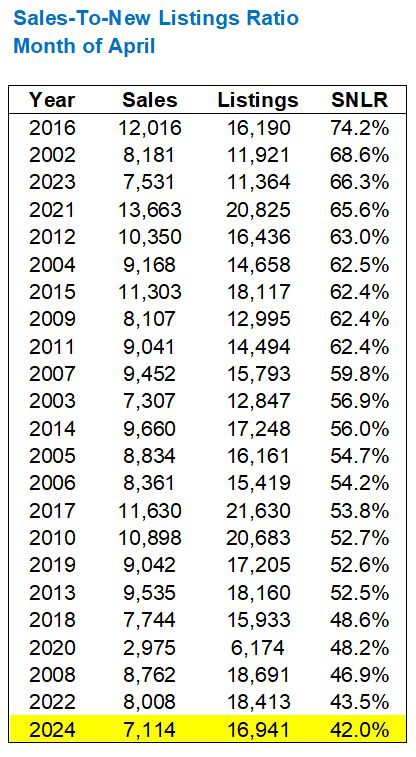
The lowest SNLR this millennium at 42.0%.
Below 50% means, in theory, we’re back into a buyer’s market. I don’t agree, nor does the market, but this is hardly a bullish indicator.
All told, the active listings at the end of the month increased significantly, both month-over-month (+45.2% from March) and year-over-year (+74.4% from April of 2023).
But we’re far, far from seeing the most active listings of all time:
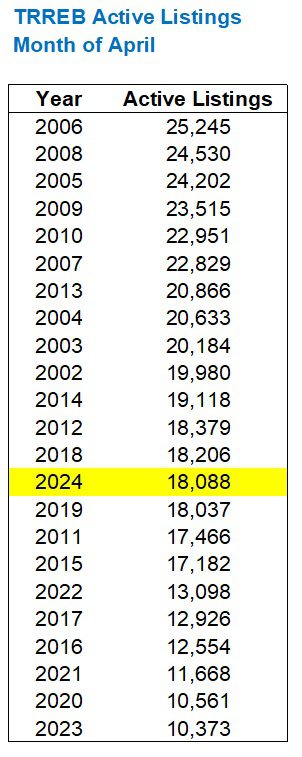
That’s odd to me.
We have the lowest SNLR in any month of April, and yet active listings are actually below average.
Really, really odd.
In any event, how do we look forward?
Here’s how April prices have led to May prices since 2002:
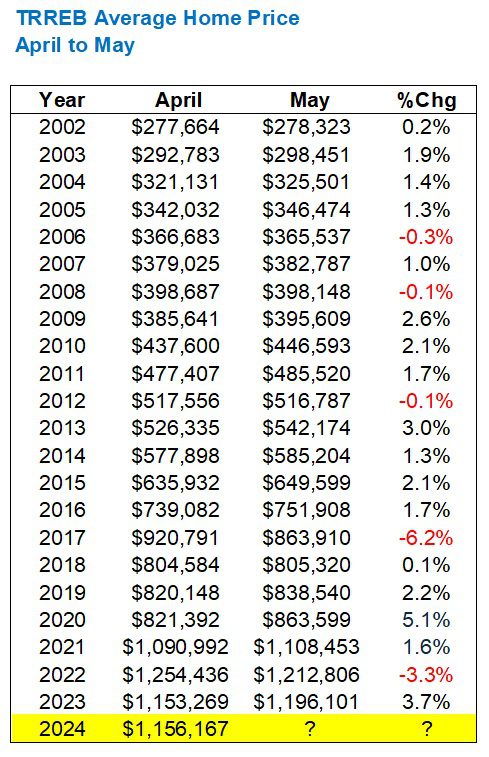
2008, 2017, and 2022 were years of market decline.
So shall we assume that the market adds another 3% in May?
For the record, to get to the $1,200,000 mark, the average home price would have to increase by 3.79%.
Hardly impossible.
But also consider that the spring peak occurs in the month of May, more often than not.
Here’s a chart I’ve shown to at least a dozen clients in the past two months:
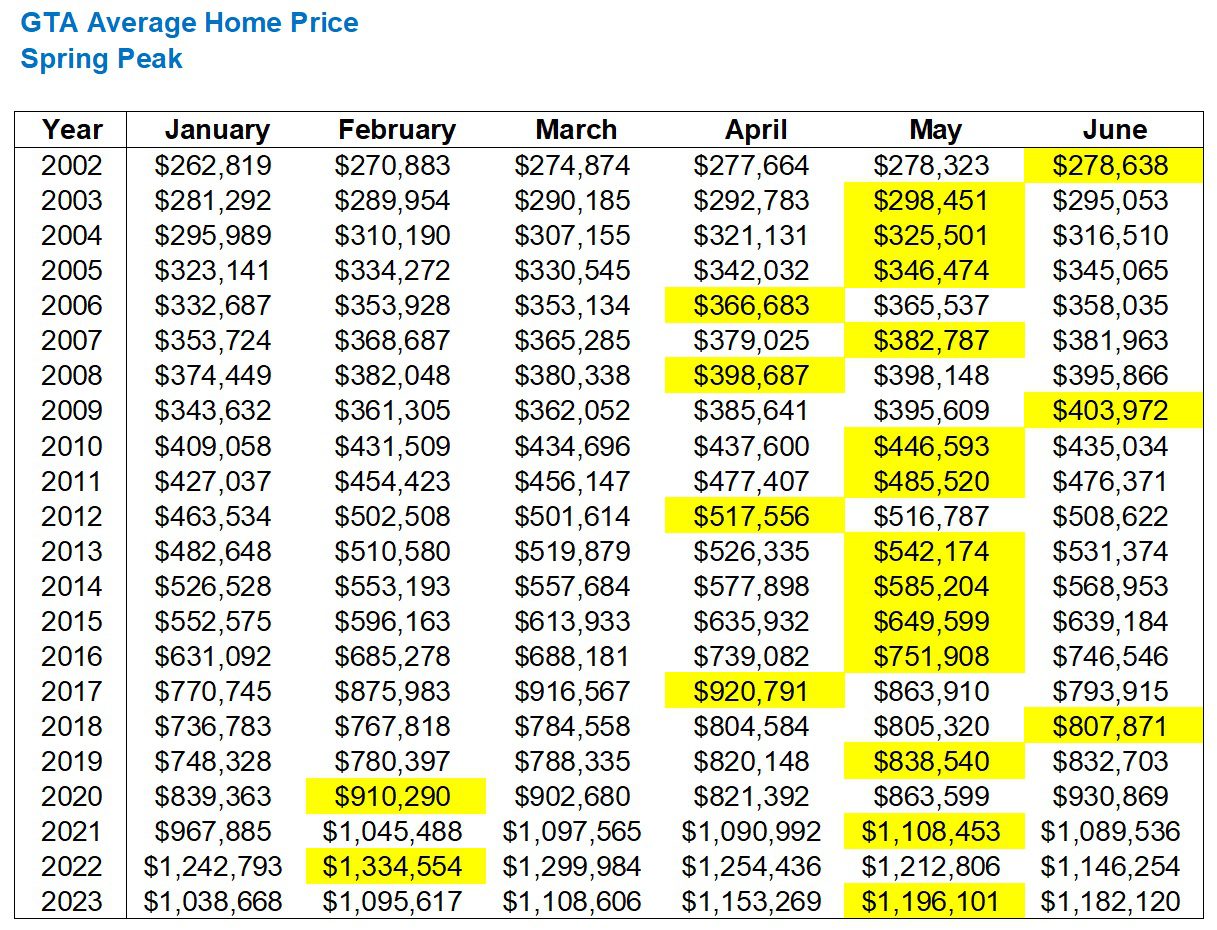
We’ve seen a May peak in thirteen of twenty-two years.
And in 2006, 2008, and 2012, the delta was a few hundred dollars.
Now having seen all this, which side are you on?
Because I could make either argument.
On the one hand: sales are low, listings are high(er), and the absorption rate is low.
On the other hand: prices increased regardless.
Is it possible that the Toronto real estate market is just so resilient that not even bearish market stats have a negative affect?
If we see another month of low sales, high listings, and low absorption and the average home price increases yet again, then it may very well be possible that we’re holding the real estate equivalent of a two-headed coin…