You’ve already heard how I feel that the January TRREB stats don’t support what’s happening out there in the market, right?
And some of you are tired of that already?
I know, I know.
You don’t want to hear about our recent east-side sale that fetched $200,000 more than it was listed at with another agent last fall. That’s not going to explain what’s happening in the market.
It’s all about those awful January TRREB stats that show the real estate market is about to crumble.
Houses will drop in price by 50%. Right?
Maybe more, if you ask the really dedicated market bears.
I know that it’s possible to be bearish without being predicting catastrophe, so I’ll admit there’s more than one kind of bearishness. But I also frequent the comment sections on real estate articles in the major newspapers and the Toronto Life’s and BlogTO’s of the world, and there really are people out there that believe the $2,000,000 Toronto homes will be readily available for $800,000 in the near future…
But if you do want to stick to those January TRREB numbers, I’ve got one for you:
0.02%
Not a sexy number, right? In fact, it’s almost not a number.
But that represents the increase in the average 416 condo price from December to January; from $709,283 to $709,419.
Why do we care?
Well, because if you take the other averages, which I don’t, since I think they’re absurd, then this would compare rather favourably!
Have a look:
-5.3%: decline in GTA average
-9.7%: decline in 416 average
-3.5%: decline in 416 detached
+2.2%: increase in 416 semi
-18.7%: decline in 416 row/town
Sure.
Your semi is worth 2.2% more but your town, which is the same thing, but attached at the other side, is worth 18.7% less.
Maybe I’m guilty of using month-over-month data when it suits me, and advising people not to look at the data when it doesn’t.
Let’s see what I say about the TRREB data in February and come back to the above point.
But I don’t believe that the “average” home is worth 5.3% less in January than in December, and I also don’t believe that condo prices are flat.
Last year, it was a quarterly exercise here on TRB to look at C01 and C08 rentals in the condo market, as we did last Thursday.
But it was also a quarterly exercise to look at the overall condo resale market, and I’d like to come back to that today.
The fourth-quarter of 2023 was quite poor in the rental market. That may have led to the current conditions in the rental market which show saturation.
But does that have any effect on condo sales?
If you believe that “most condo buyers are investors,” then maybe.
But I think there are far, far more end-users out there right now than investors, and I think that was even more pronounced in the fall.
So let’s start by looking at the 416 condo units sold and see how the fourth quarter finished:
There’s an argument to be made here that the 416 condo market finished strong.
Considering the weak overall sales numbers in 2023 – the fewest sales this millennium, we might have figured that the year-over-year data for October, November, and December would plummet.
But it didn’t.
In fact, it was pretty much on par with 2023.
Look at how 2023 started: with 604 condo sales in the 416 compared to 1,409 in 2022.
That’s a year-over-year decline of 57.1% in January and a year-over-year decline of 0.8% in December.
Then again, if you want to be bearish, you could simply note that the 416 saw the fewest sales in October, November, and December of any year in the chart above.
Fine.
That’s also quite evident in the graph:
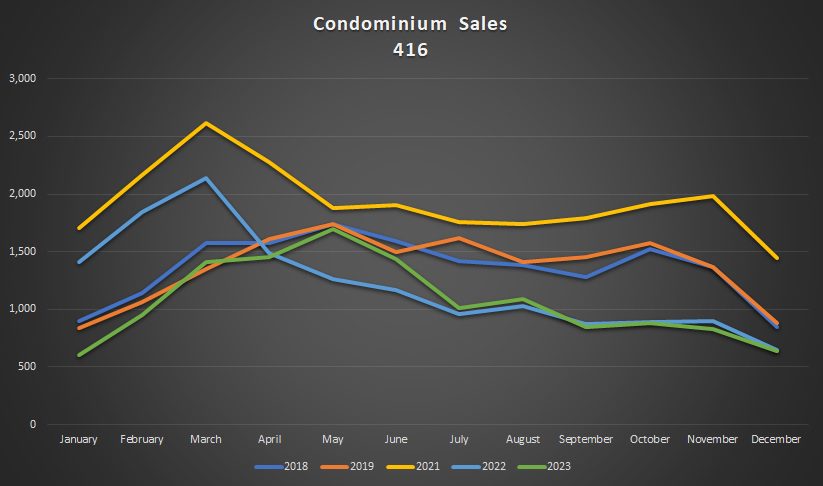
It’s interesting that 2023 condo sales in the 416 surpassed 2022 and came about even with 2018 and 2019 in Q2 – April, May, and June, but we saw 66,315 overall sales in 2023 and 75,652 in 2022.
It’s also interesting that Q1 of 2023 was so hot! Well ahead of 2018 and 2019, but obviously nothing compared to the incredible year we saw in 2021.
Throughout Q4 as we noted in the chart above, 416 condo sales were basically even with 2022. I think that speaks to strength in the condo market.
The pattern was very similar in the 905 regions:
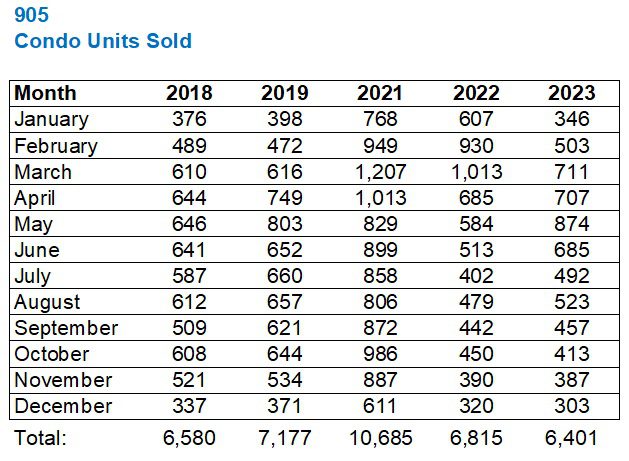
Note that while 416 condo sales were down by 12.0% in 2023, over 2022, the 905 condo sales were only down by 6.1%.
Strength in the 905? Really?
This was a big surprise to me, as it was throughout the whole year. Every time we ran this feature last year, the 905 looked like it was in fair shape.
Now, if we compare both the 416 and 905 to the “peak” year in 2021, they pull closer:
416: down 44.5%
905: down 40.1%
Here’s how last year’s 905 data presents graphically:

It’s a very similar theme, although the largest difference would be in December. The four years – 2018, 2019, 2022, and 2023, are relatively even in sales in December, unlike the 416, where 2018 and 2019 are well ahead.
So this brings me to the absorption rates, which I want to examine in the context of the condo market and then in comparison to the overall market.
Why?
Well, because we might come to one conclusion just looking at condos-versus-condos, but might come to another looking at condos-versus-houses.
Here’s the data for the 416:
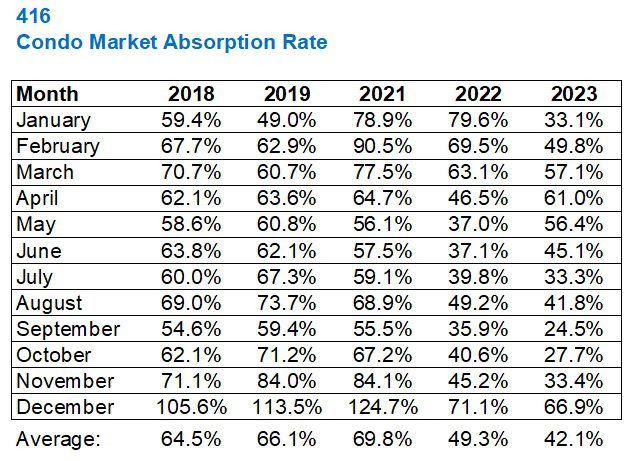
Again, I would look at how 2023 started and how it finished.
January saw a 33.1% absorption rate compared to 79.6% the year before.
But December saw a 66.9% absorption rate compared to 71.1% in 2022.
Frankly, I’m surprised the condo market finished the way it did, given the start.
Of course, this is comparing only to 2022, and we could point out that the absorption rates for 2018, 2019, and 2021 were over 100%, and both 2022 and 2023 pale in comparison.
It’s worth noting that the average condo price is still higher in 2023 than in 2018, 2019, or 2021, so the absorption rate only tells part of the story.
There’s a relationship between absorption rate and pricing, but not to the extent some would “hope” if they’re looking for falling prices.
Here’s the graph:
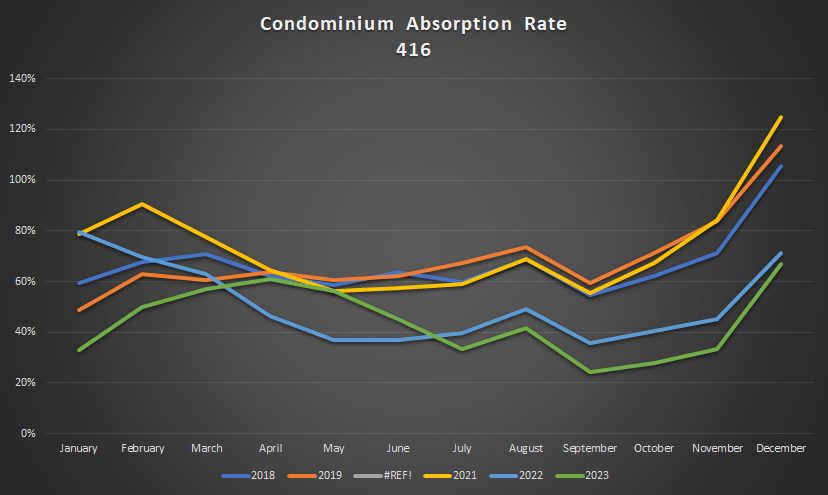
The absorption rate graph for Q2 in 2022 and 2023 seems to follow the same graph for sales, in that there was a weakness in 2022, but it’s interesting that the absorption rate was so much lower in Q4 of 2023 and yet we saw the same amount of sales.
Here’s the 905 absorption rate:
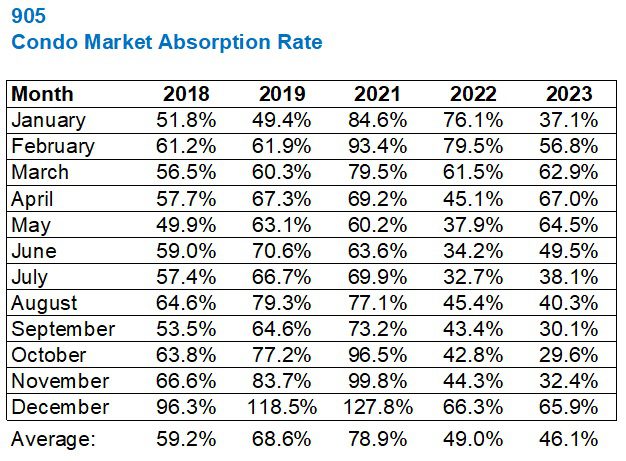
Essentially the same in Q4 as the 416 data and nothing really surprising here.
The main difference when comparing 416 and 905 is the divergence in absorption rates in the last four months of the year:

The lines are much tighter in the 416 than in the 905, although both the 416 and the 905 show a convergence in the absorption rate for 2022 and 2023.
Now, I mentioned that I wanted to compare absorption rates in 2023 for these years:
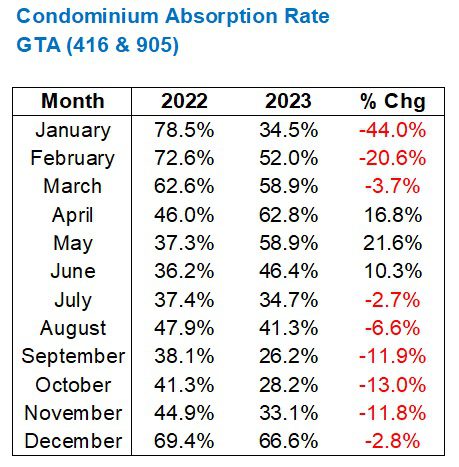
This was sort of noted in the charts above, but not specifically.
What I see here is a 2023 condo market that started ice-cold compared to 2022, warmed up significantly in the second quarter and actually got hotter than in 2022, then cooled in the latter half of the year, but finished strong.
Perhaps that’s why the average 416 condominium price held steady in January while the other property types declined?
Through the first half of February, there have been 2,834 sales recorded.
Double that figure to get us to month’s end, and perhaps round up to account for the conditional sales, and we’re looking at around 8,000 sales in February.
2023 saw only 4,783.
Prices haven’t made the push. Yet. But I would say that the buyer appetite is back…